1、安装mrtg和snmp apt-get install mrtg snmpd sar curl 2、配置snmpd 编辑/etc/snmp/snmpd.conf文件 改为如下内容即可: com2sec notConfigUser localhost public group notConfigGroup v1 notConfigUser group notConfigGroup v2c notConfigUser view systemview included .1.3.6.1.2.1.1 view systemview included .1.3.6.1.2.1.25.1.1 access notConfigGroup "" any noauth exact all none none view all included .1 80 syslocation Unknown (edit /etc/snmp/snmpd.conf) syscontact Root修改完成后重启snmpd service snmpd restartsnmp功能强大但这里只需要比较简单的功能(获取网卡流量),这么配置就ok了。 3、准备一些脚本
#!/bin/bash
# run this script to check the mem usage.
swapmem=`/usr/bin/free |grep Swap |awk '{print $3}'`


usedmem=`/usr/bin/free |grep Mem |awk '{print $3}'`
UPtime=`/usr/bin/uptime | awk '{print $3""$4""$5}'`
echo $usedmem
echo $swapmem
echo $UPtime
hostname
#!/bin/bash
cpuusr=`/usr/bin/sar -u 1 3 | grep Average | awk '{print $3}'`
cpusys=`/usr/bin/sar -u 1 3 | grep Average | awk '{print $5}'`
UPtime=`/usr/bin/uptime | awk '{print $3""$4""$5}'`
echo $cpuusr
echo $cpusys
echo $UPtime
hostname
在nginx中配置如下:
location ~ ^/nginx_status {
  stub_status on;
  access_log off;
}
配置加上这个后,你就可以通过http://localhost/nginx_status 这种方式来获取nginx的实时连接数信息。 例如访问http://localhost/nginx_status: Active connections: 55 server accepts handled requests 154905 154905 393798 Reading: 0 Writing: 1 Waiting: 54但是这还不够,因为mrtg需要的是纯数据,我们同样还需要一个脚本将数据提取出来, 我们使用curl将数据获取到并使用awk将数据提取出来存到临时文件中。 将如下代码保存为/home/mrtg/nginx_status,并赋予可执行权限(755)
curl http://localhost/nginx_status | grep Active | awk '{print $3 }'  > /home/mrtg/mrtg-2/ngx.active
curl http://localhost/nginx_status | grep Waiting | awk '{print $6 }' > /home/mrtg/mrtg-2/ngx.waiting
将如下代码保存为/home/mrtg/mrtg.ngx,并赋予可执行权限(755)
#!/usr/bin/perl -W
`/home/mrtg/nginx_status`;
$hostname=`hostname`;
$hostname=~s/\s+$//;
$nginx_active_conn=`tail /home/mrtg/ngx.active`;
$nginx_waiting_conn=`tail /home/mrtg/ngx.waiting`;
$nginx_active_conn=~s/\n$//;
$nginx_waiting_conn=~s/\n$//;
$nginx_active_conn=~s/^\s+|\s+$//;
$nginx_waiting_conn=~s/^\s+|\s+$//;
$gettime=`uptime|awk '{print \$1" "\$3" "\$4}'`;
$gettime=~s/\,|\n$//g;
print("$nginx_active_conn\n");
print("$nginx_waiting_conn\n");
print("$gettime\n");
print("$hostname\n");
4、配置mrtg 默认的mrtg的配置文件是/etc/mrtg.cfg 我们需要使用命令cfgmaker来生成配置文件,具体命令如下: cfgmaker public@localhost --output /etc/mrtg.cfg然后可以看到文件中已经有了一些配置,网卡流量相关的配置已经生成好了,我们需要将cpu、内存、nginx连接数的配置补进去。 添加如下配置: WorkDir: /home/mrtg/mrtg Options[_]: growright, bits EnableIPv6: no Target[cpu]: `/home/mrtg/mrtg.cpu` MaxBytes[cpu]: 100 Options[cpu]: gauge, nopercent, growright YLegend[cpu]: CPU loading (%) ShortLegend[cpu]: % LegendO[cpu]: CPU us; LegendI[cpu]: CPU sy; Title[cpu]: CPU Loading PageTop[cpu]: <H1>CPU Loading</H1> Target[ram]: `/home/mrtg/mrtg.ram` #Unscaled[ram]: dwym MaxBytes[ram]: 16424724 注意,这里的数值为服务器内存的最大值,可通过free命令查看。 Title[ram]:Memory ShortLegend[ram]: & kmg[ram]:kB,MB kilo[ram]:1024 YLegend[ram]: Memory Usage : Legend1[ram]: Swap Memory : Legend2[ram]: Used Memory : LegendI[ram]: Swap Memory : LegendO[ram]: Used Memory : Options[ram]: growright,gauge,nopercent PageTop[ram]:<H1>Memory</H1> Target[nginx_conn]: `/home/mrtg/mrtg.ngx` Options[nginx_conn]: gauge,nopercent,growright Directory[nginx_conn]: nginx_conn MaxBytes[nginx_conn]: 8000 YLegend[nginx_conn]: nginx_conn ShortLegend[nginx_conn]: LegendI[nginx_conn]: Active connections: LegendO[nginx_conn]: Waiting: Title[nginx_conn]: Nginx PageTop[nginx_conn]:<h1>nginx</h1>cfgmaker生成的从snmp获取网卡流量的部分配置如果不懂的话最好不要动。 最终的mrtg配置看起来像这样,但是不能照搬,需要灵活根据自己的情况进行调整: WorkDir: /home/mrtg/mrtg Options[_]: growright, bits EnableIPv6: no Target[cpu]: `/home/mrtg/mrtg.cpu` MaxBytes[cpu]: 100 Options[cpu]: gauge, nopercent, growright YLegend[cpu]: CPU loading (%) ShortLegend[cpu]: % LegendO[cpu]: CPU us; LegendI[cpu]: CPU sy; Title[cpu]: CPU Loading PageTop[cpu]: <H1>CPU Loading</H1> Target[ram]: `/home/mrtg/mrtg.ram` #Unscaled[ram]: dwym MaxBytes[ram]: 32687592 Title[ram]:Memory ShortLegend[ram]: & kmg[ram]:kB,MB,GB kilo[ram]:1024 YLegend[ram]: Memory Usage : Legend1[ram]: Swap Memory : Legend2[ram]: Used Memory : LegendI[ram]: Swap Memory : LegendO[ram]: Used Memory : Options[ram]: growright,gauge,nopercent PageTop[ram]:<H1>Memory</H1> Target[nginx_conn]: `/home/mrtg/mrtg.ngx` Options[nginx_conn]: gauge,nopercent,growright Directory[nginx_conn]: nginx_conn MaxBytes[nginx_conn]: 8000 YLegend[nginx_conn]: nginx_conn ShortLegend[nginx_conn]: LegendI[nginx_conn]: Active connections: LegendO[nginx_conn]: Waiting: Title[nginx_conn]: Nginx PageTop[nginx_conn]:<h1>nginx</h1> ### Interface 2 >> Descr: 'eth0' | Name: 'eth0' | Ip: '192.168.1.123' | Eth: '00-16-3e-00-0d-71' ### ### The following interface is commented out because: ### * has no ifSpeed property # Target[localhost_eth0]: #eth0:public@localhost: SetEnv[localhost_eth0]: MRTG_INT_IP="192.168.1.123" MRTG_INT_DESCR="eth0" MaxBytes[localhost_eth0]: 12500000 Title[localhost_eth0]: 192.168.1.123 -- git-osc PageTop[localhost_eth0]: <h1><span style="font-size:9pt;line-height:1.5;">192.168.1.123 -- git-osc</h1></span> <div id="sysdetails"> <table> <tr> <td>System:</td> <td>git-osc in Unknown (edit /etc/snmp/snmpd.conf)</td> </tr> <tr> <td>Maintainer:</td> <td>Root</td> </tr> <tr> <td>Description:</td> <td>eth0 </td> </tr> <tr> <td>ifType:</td> <td>ethernetCsmacd (6)</td> </tr> <tr> <td>ifName:</td> <td>eth0</td> </tr> <tr> <td>Max Speed:</td> <td>0.0 Bytes/s</td> </tr> <tr> <td>Ip:</td> <td>192.168.1.123</td> </tr> </table> </div> ## Interface 3 >> Descr: 'eth1' | Name: 'eth1' | Ip: '192.168.1.134' | Eth: '00-16-3e-00-0d-8e' ### ## The following interface is commented out because: ## * has no ifSpeed property Target[localhost_eth1]: #eth1:public@localhost: SetEnv[localhost_eth1]: MRTG_INT_IP="192.168.1.134" MRTG_INT_DESCR="eth1" MaxBytes[localhost_eth1]: 2500000 Title[localhost_eth1]: 192.168.1.134 -- git-osc PageTop[localhost_eth1]: <h1>192.168.1.134 -- git-osc</h1> <div id="sysdetails"> <table> <tr> <td>System:</td> <td>git-osc in Unknown (edit /etc/snmp/snmpd.conf)</td> </tr> <tr> <td>Maintainer:</td> <td>Root</td> </tr> <tr> <td>Description:</td> <td>eth1 </td> </tr> <tr> <td>ifType:</td> <td>ethernetCsmacd (6)</td> </tr> <tr> <td>ifName:</td> <td>eth1</td> </tr> <tr> <td>Max Speed:</td> <td>0.0 Bytes/s</td> </tr> <tr> <td>Ip:</td> <td>192.168.1.134</td> </tr> </table> </div><span style="font-family:'sans serif', tahoma, verdana, helvetica;font-size:10pt;line-height:1.5;"></span>MaxBytes[localhost_eth0]和MaxBytes[localhost_eth1]的数值分别为两块网卡的峰值流量,单位byte。 5、生成mrtg首页 mkdir /home/mrtg/mrtg indexmaker /etc/mrtg.cfg > /home/mrtg/mrtg/index.html 6、使用mrtg绘制数据图表 env LANG=C mrtg /etc/mrtg.cfg配置crontab定时采集数据,并绘制图表 1/5 * * * * env LANG=C /usr/bin/mrtg /etc/mrtg.cfg这里为每五分钟采集一次,可活动调整。 7、配置nginx查看结果 在nginx中添加如下配置:
location ~ ^/mrtg {
      root /home/mrtg;
}
8、查看结果 http://localhost/mrtg 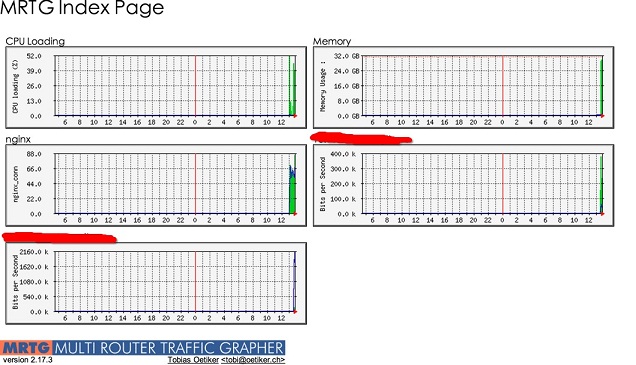 红线刮掉的是网卡流量的title,因为有两块网卡所以就有两个统计结果。 9、注意事项 这里的http://localhost/nginx_status 和http://localhost/mrtg 没有加权限控制,你可以通过配置nginx加上http的基础认证,或者限定只有某些指定的IP可以访问,具体配置办法不在本文范畴之内,可查阅相关文档或者搜索得到结果。 From:http://my.oschina.net/jack230230/blog/150470 转载请保留固定链接: https://linuxeye.com/configuration/1885.html |